2024-09 CREATOR conumdrum

This month I wish to „rake over“ some hot coals from yesteryear…

The good ol‘ days!

Remember when we had just eight-byte CREATORs ? Prior to the „big bang“ DB2 V8 all the creators and table names were limited to eight and eighteen bytes respectively. This was then changed in DB2 V8 to both be VARCHAR(128). So far so good!

And?

What went wrong was the way IBM development handled the SYSIBM creator…

Why is this a problem?

Well if you are writing SQL to access the Db2 Catalog and you wish to use wild cards, E.g. % or _, then you must start taking care of your predicate texts!

Here are some examples of SQL that should do the same thing, but don’t!

Baseline counts

First, here’s a little SQL to simply show us some numbers:

SELECT COUNT(*), CREATOR
FROM SYSIBM.SYSINDEXES
WHERE (CREATOR LIKE 'SYSIB_'
OR CREATOR LIKE 'SYSIBM_'
OR CREATOR LIKE 'SYSIBM _'
OR CREATOR LIKE 'SYSIB%'
OR CREATOR LIKE 'SYSIBM%'
OR CREATOR LIKE 'SYSIBM %')
AND NOT CREATOR = 'SYSIBMTS'
GROUP BY CREATOR
FOR FETCH ONLY
WITH UR
;

When I run this in my Db2 13 system I get this result:

---------+---------+---------+---------
CREATOR
---------+---------+---------+---------
317 SYSIBM
DSNE610I NUMBER OF ROWS DISPLAYED IS 1

and??

Now comes the interesting bit…

Here are six SQLs all nearly the same but look at the COUNT values.

SELECT COUNT(*)                         
FROM SYSIBM.SYSINDEXES
WHERE CREATOR LIKE 'SYSIB_'
AND NOT CREATOR = 'SYSIBMTS'
FOR FETCH ONLY
WITH UR
;
---------+---------+---------+---------+

---------+---------+---------+---------+
187
DSNE610I NUMBER OF ROWS DISPLAYED IS 1


SELECT COUNT(*)
FROM SYSIBM.SYSINDEXES
WHERE CREATOR LIKE 'SYSIBM_'
AND NOT CREATOR = 'SYSIBMTS'
FOR FETCH ONLY
WITH UR
;
---------+---------+---------+---------+

---------+---------+---------+---------+
0
DSNE610I NUMBER OF ROWS DISPLAYED IS 1


SELECT COUNT(*)
FROM SYSIBM.SYSINDEXES
WHERE CREATOR LIKE 'SYSIBM _'
AND NOT CREATOR = 'SYSIBMTS'
FOR FETCH ONLY
WITH UR
;
---------+---------+---------+---------+

---------+---------+---------+---------+
130
DSNE610I NUMBER OF ROWS DISPLAYED IS 1


SELECT COUNT(*)
FROM SYSIBM.SYSINDEXES
WHERE CREATOR LIKE 'SYSIB%'
AND NOT CREATOR = 'SYSIBMTS'
FOR FETCH ONLY
WITH UR
;
---------+---------+---------+---------+

---------+---------+---------+---------+
317
DSNE610I NUMBER OF ROWS DISPLAYED IS 1


SELECT COUNT(*)
FROM SYSIBM.SYSINDEXES
WHERE CREATOR LIKE 'SYSIBM%'
AND NOT CREATOR = 'SYSIBMTS'
FOR FETCH ONLY
WITH UR
;
---------+---------+---------+---------+

---------+---------+---------+---------+
317
DSNE610I NUMBER OF ROWS DISPLAYED IS 1


SELECT COUNT(*)
FROM SYSIBM.SYSINDEXES
WHERE CREATOR LIKE 'SYSIBM %'
AND NOT CREATOR = 'SYSIBMTS'
FOR FETCH ONLY
WITH UR
;
---------+---------+---------+---------+

---------+---------+---------+---------+
130
DSNE610I NUMBER OF ROWS DISPLAYED IS 1

You see the difference? The reason is clear as „some“ of the SYSIBM creators, 130 in this example, got the varchar length of *eight* when the change to V8 happened. However, 187 got the correct length of six.

This is normally never seen of course as it is SYSIBM stuff but if you write SQL against the catalog and you are using host variables then be careful when predicates use the CREATOR!

The same results come from Static SQL of course.

Is there a fix?

Now in SQL you can fix this by either adding a STRIP around the CREATOR -> WHERE STRIP(CREATOR) LIKE = :HOST-VAR or you can „cheat“ by *not* using a VARCHAR host variable and then the trailing two spaces and the extra two bytes in the length are then „ignored“ by predicate processing.

Which one to do?

You gotta CHEAT! Why? because STRIP is a non-indexable function! If the tables are very small probably ok but for normal ones a very bad idea!!!

Just for fun!

Here’s some „discovery“ SQL that builds a bunch of SELECT statements that you can then simply run in SPUFI. Take the output and then, after deleting the generator output SQL, the last sets of SPUFI output and adding at the front the

--#SET TERMINATOR $

Plus adding the

--#SET TERMINATOR ;

at the end – Just for good style! – You can then also execute it in SPUFI.

DECLARE GLOBAL TEMPORARY TABLE T (LINENO INTEGER NOT NULL)      
;
-- INSERT SIX LINES
INSERT INTO SESSION.T VALUES 1
;
INSERT INTO SESSION.T VALUES 2
;
INSERT INTO SESSION.T VALUES 3
;
INSERT INTO SESSION.T VALUES 4
;
INSERT INTO SESSION.T VALUES 5
;
INSERT INTO SESSION.T VALUES 6
;
SELECT CASE LINENO
WHEN 1 THEN 'SELECT DISTINCT SUBSTR(' CONCAT SUBSTR(NAME, 1, 18)
CONCAT ' , 1 , 8) AS CREATOR '
WHEN 2 THEN ' ,LENGTH(' CONCAT SUBSTR(NAME, 1, 18)
CONCAT ') AS LEN'
WHEN 3 THEN 'FROM SYSIBM.' CONCAT SUBSTR(TBNAME , 1, 18)
WHEN 4 THEN 'WHERE '
CONCAT SUBSTR(NAME, 1, 18) CONCAT ' LIKE ''SYSIBM%'' '
WHEN 5 THEN 'AND NOT '
CONCAT SUBSTR(NAME, 1, 18) CONCAT ' = ''SYSIBMTS'' '
WHEN 6 THEN ' $'
END
FROM SYSIBM.SYSCOLUMNS
,SESSION.T
WHERE NAME LIKE '%CREATOR%'
AND TBCREATOR = 'SYSIBM'
AND COLTYPE = 'VARCHAR'
ORDER BY TBCREATOR
,TBNAME
,NAME
,LINENO
FOR FETCH ONLY
WITH UR
;

My output, after I have edited the start, looks like this:

EDIT       BOXWELL.SPUFI.IN(AAA1) - 01.07                          Co
Command ===>
****** ********************************* Top of Data ****************
000001 --#SET TERMINATOR $
000002 SELECT DISTINCT SUBSTR(CREATOR , 1 , 8) AS CREATOR
000003 ,LENGTH(CREATOR ) AS LEN
000004 FROM SYSIBM.DSNPROGAUTH
000005 WHERE CREATOR LIKE 'SYSIBM%'
000006 AND NOT CREATOR = 'SYSIBMTS'
000007 $
000008 SELECT DISTINCT SUBSTR(CREATOR , 1 , 8) AS CREATOR
000009 ,LENGTH(CREATOR ) AS LEN
000010 FROM SYSIBM.SYSCHECKS
000011 WHERE CREATOR LIKE 'SYSIBM%'
000012 AND NOT CREATOR = 'SYSIBMTS'
000013 $
000014 SELECT DISTINCT SUBSTR(CREATOR , 1 , 8) AS CREATOR
000015 ,LENGTH(CREATOR ) AS LEN
000016 FROM SYSIBM.SYSCOLAUTH
000017 WHERE CREATOR LIKE 'SYSIBM%'
000018 AND NOT CREATOR = 'SYSIBMTS'
000019 $
.
.
.

When you then run this, you will get a nice list of all tables with either zero, one or two rows of output. The ones with two rows are the dodgy CREATOR lengths! Here’s one from my system:

SELECT DISTINCT SUBSTR(TBCREATOR          , 1 , 8) AS CREATOR
,LENGTH(TBCREATOR ) AS LEN
FROM SYSIBM.SYSCOLUMNS
WHERE TBCREATOR LIKE 'SYSIBM%'
AND NOT TBCREATOR = 'SYSIBMTS'
$
---------+---------+---------+---------+---------+---------+-
CREATOR LEN
---------+---------+---------+---------+---------+---------+-
SYSIBM 6
SYSIBM 8
DSNE610I NUMBER OF ROWS DISPLAYED IS 2

TTFN

Roy Boxwell

2024-08 BSDS What is actually in it?

I have been asked on numerous occasions where in the wide, wide world of Db2 does it store the sizes and settings of buffer pools and group buffer pools?

Survivability

Naturally, these things must survive a Db2 stop/start and also an IPL – so where do they live?

Buried in the IBM Db2 documentation is one place where it just mentions that buffer pool data is stored in the BSDS. In fact, under ALTER BUFFERPOOL, is this text:

Altering buffer pools

Last Updated: 2024-05-14

Db2 stores buffer pool attributes in the Db2 bootstrap data set (BSDS). You can change buffer pool attributes.

IBM Db2 ALTER Command

Just the Facts, Ma’am

OK, as you are all aware, a DSNJU004 print log map shows this BSDS data:

  • The data set name (DSN) of the BSDS.
  • The system date and time (SYSTEM TIMESTAMP), and the date and time that the BSDS was last changed by the change log inventory utility (UTILITY TIMESTAMP).
  • The ICF catalog name that is associated with the BSDS.
  • The highest-written RBA. The value is updated each time the log buffers are physically written to disk.
  • The highest RBA that was offloaded.
  • Log RBA ranges (STARTRBA and ENDRBA), and data set information for active and archive log data sets. The last active log data set that is listed in the output is the current active log.
  • Information about each active log data set.
  • Information about each archive log data set.
  • Conditional restart control records.
  • The contents of the checkpoint description queue.
  • Archive log command history.
  • The distributed data facility (DDF) communication record. This record contains the location name as defined by Db2, any alias names for the location name, and the LU name as defined by VTAM. Db2 uses this information to establish the distributed database environment.
  • The tokens for all BACKUP SYSTEM utility records.
  • The ENFM START RBA/LRSN field contains one of the following values:
    • In a non-data sharing environment, the RBA when the most recent enabling-new-function mode job started on the subsystem

    • In a data sharing environment, the LRSN when the most recent enabling-new-function mode job started on a member
  • Information about members of a data sharing group, including deactivated members and destroyed members whose slots were reclaimed.

You may have noticed that in this list the BPs and GBPs are noticeably(!) absent!

Pulled up with Your Own Bootstraps!

Now the BSDS is arguably the most important dataset for Db2 as it literally “pulls itself up with its own bootstraps” – hence the name. It is a simple VSAM dataset with a four-byte key that you can browse while Db2 is up and running or, if you are worried, just REPRO it to a flat file like this:         

//*
//* REPRO VSAM OVER                                     
//*                                                      
//REPRO    EXEC PGM=IDCAMS                              
//SYSPRINT DD SYSOUT=*                                  
//INDD     DD DISP=SHR,DSN=my.db2.BSDS01                 
//OUTDD    DD DISP=(,CATLG,DELETE),DSN=my.flat.file,    
//            SPACE=(CYL,(5,5),RLSE),                   
//            DCB=(LRECL=8192,RECFM=VB)                 
//SYSIN    DD *                                         
 REPRO INFILE(INDD) OUTFILE(OUTDD)                      
/*  

Hidden Secrets

IBM have, to my knowledge, never documented the internal structure of the BSDS – and why should they? It is really just for Db2 internal use, but I love to figure things out. So, I REPRO’d a non-data sharing and a data sharing BSDS and ran the DSNJU004 and just looked for stuff in the BSDS that is not output by the utility.

Differences Aplenty!

What you notice, is that there are quite a few bits of data not externalized, for whatever reason. The aforementioned buffer pools and group buffer pools, of course, and then the full list of DDF ALIASes, and also what I guess are a whole bunch of “recent log checkpoints” but I am not 100% sure and just ignored them!

ISPF F is Your Friend

You can page on down through or you can just do a “F WPAR” as in all my systems this was there and so I guess it is an eyecatcher of sorts! The VSAM key is x’0A000001’ and the start looks like:

Buffer Pool ID

Remember that internally, Db2 uses buffer pool ids to map the buffer pools. These numbers are *not* consecutive or in order for historical and, perhaps, even future growth reasons. Here’s a handy little cross reference table:

Buffer pool IDBuffer pool sizeBuffer pool name
0 – 494KBP0 – BP49
80 – 8932KBP32K – BP32K9
100 – 1098KBP8K0 – BP8K9
120 – 12916KBP16K0 – BP16K9

It is HEX Time!

Then at position 60, the data blocks begin with 32 bytes for each Bufferpool. Here is Buffer pool id 0 (BP0):

You can see that we have x’00004E20’ pages – 20,000 and also x’000007D0’ – 2000 simulated pages. The rest of the data is thresholds etc. This then repeats for all buffers out to the right.

And Now in Human-Readable Form

Here’s a -DISPLAY BUFFERPOOL(BP0) for comparison:

DSNB401I  -DD10 BUFFERPOOL NAME BP0, BUFFERPOOL ID 0, USE COUNT 751
DSNB402I  -DD10 BUFFER POOL SIZE = 20000 BUFFERS  AUTOSIZE = NO    
            VPSIZE MINIMUM  =         0  VPSIZE MAXIMUM  =         0
            ALLOCATED       =     20000  TO BE DELETED   =         0
            IN-USE/UPDATED  =       355  OVERFLOW ALLOC  =         0
DSNB431I  -DD10 SIMULATED BUFFER POOL SIZE = 2000 BUFFERS -        
            ALLOCATED       =      2000                            
            IN-USE          =      1988  HIGH IN-USE     =      2000
            SEQ-IN-USE      =      1495  HIGH SEQ-IN-USE =      1734
DSNB406I  -DD10 PGFIX ATTRIBUTE -                                  
             CURRENT = NO                                          
             PENDING = NO                                           
           PAGE STEALING METHOD -                                  
             CURRENT = LRU                                         
             PENDING = LRU                                         
DSNB404I  -DD10 THRESHOLDS -                                       
            VP SEQUENTIAL    = 80   SP SEQUENTIAL   = 80           
            DEFERRED WRITE   = 30   VERTICAL DEFERRED WRT  =  5,  0
            PARALLEL SEQUENTIAL =50   ASSISTING PARALLEL SEQT=  0   
DSNB546I  -DD10 PREFERRED FRAME SIZE 4K                            
        20000 BUFFERS USING 4K FRAME SIZE ALLOCATED                
DSN9022I  -DD10 DSNB1CMD '-DISPLAY BUFFERPOOL' NORMAL COMPLETION

Data-Sharing?

If you have data-sharing then you get some bonus lines in the BSDS:

As you can see, it lists out one line per GBP. Note how the VSAM Key is now x’0A0001nn’ where nn is the buffer pool id in hexadecimal. Remember: 0 – 49, 80 – 89, 100 – 109 and 120 – 129.

Now, Again, in Human-Readable Form

Here’s the -DISPLAY GROUPBUFFERPOOL output for comparison:

DSNB750I  -SD10 DISPLAY FOR GROUP BUFFER POOL GBP0 FOLLOWS
DSNB755I  -SD10 DB2 GROUP BUFFER POOL STATUS                       
             CONNECTED                                 = YES       
             CURRENT DIRECTORY TO DATA RATIO           = 10        
             PENDING DIRECTORY TO DATA RATIO           = 10        
             CURRENT GBPCACHE ATTRIBUTE                = YES       
             PENDING GBPCACHE ATTRIBUTE                = YES       
DSNB756I  -SD10   CLASS CASTOUT THRESHOLD                   = 5, 0 
             GROUP BUFFER POOL CASTOUT THRESHOLD       = 30%       
             GROUP BUFFER POOL CHECKPOINT INTERVAL     = 4 MINUTES 
             RECOVERY STATUS                           = NORMAL    
             AUTOMATIC RECOVERY                        = Y         
DSNB757I  -SD10 MVS CFRM POLICY STATUS FOR GSD10C11_GBP0    = NORMAL
             MAX SIZE INDICATED IN POLICY              = 24576 KB  
             DUPLEX INDICATOR IN POLICY                = DISABLED  
             CURRENT DUPLEXING MODE                    = SIMPLEX   
             ALLOCATED                                 = YES       
DSNB758I  -SD10     ALLOCATED SIZE                          = 16384
KB                                                                 
               VOLATILITY STATUS                       = VOLATILE  
               REBUILD STATUS                          = NONE      
               CFNAME                                  = CFSEG1    
               CFLEVEL - OPERATIONAL                   = 17        
               CFLEVEL - ACTUAL                        = 25        
DSNB759I  -SD10     NUMBER OF DIRECTORY ENTRIES             = 15964
               NUMBER OF DATA PAGES                    = 1595      
               NUMBER OF CONNECTIONS                   = 1         
DSNB798I  -SD10 LAST GROUP BUFFER POOL CHECKPOINT                  
                                          09:14:08 MAY 22, 2024    
             GBP CHECKPOINT RECOVERY LRSN              =           
00DF215E8A4B743F0000                                               
             STRUCTURE OWNER                           = MEMSD10   
DSNB790I  -SD10 DISPLAY FOR GROUP BUFFER POOL GBP0 IS COMPLETE     
DSN9022I  -SD10 DSNB1CMD '-DIS GROUPBUFFERPOOL' NORMAL COMPLETION

One interesting bit of info here is the DSNB758I message. Notice the CFLEVEL fields? The OPERATIONAL appears to be “stuck” at 17 as we are on a z16 using ACTUAL 25 and getting the new, in CFLEVEL 25, statistics so OPERATIONAL *should* be 25 as well!

What About the ALIAS?

The final piece is the strange case of the DDF ALIAS definition. If you simply create a DDF ALIAS it is, by definition, disabled until you complete the process. While it is in this state the DSNJU004 output just lists:

Elvis is Dead?

But in the BSDS you actually see:

And then on the same line to the right:

These were two test ALIASes I created for our SAX DBAT support.

Human-Readable Version Again

The SAX DBAT support records all the data from your DDF with the aim to show/warn you if you start running out of DBATs. It shows you all your DDF data like this:

Zooming In!

Primary cmd A for Alias:

So here you see that there are indeed two ALIASes but both are in STOPD status.

I presume that until “enabled” they are “not interesting” for DDF use … In fact, even with STATUS STARTD, I cannot find the data in the utility output…

That’s All, Folks!

These are the little nuggets I have found in the BSDS that I think are pretty interesting really, but for whatever reason IBM do not externalize them. I would hazard a guess, that this data may change at any given time and it is therefore not documented anywhere for “safety” reasons!

Aha!

Do you think it warrants an Aha idea to update the DSNJU004 to actually output the BPs, GBPs and ALIASes?

As usual I would love to hear what you think!

TTFN

Roy Boxwell

2024-07 One size fits all?

A really brief blog this month, as I found something out while playing with buffer pool tuning (I have no hobbies!)

Buffer Pools …

There has been a long debate down the years about buffer pool management. How big should they be? How many should you have? Which parameters for which type? And so on. I have written numerous blogs, held IDUG Presentations and discussed myriad times with colleagues and customers about this topic.

Something New???

I found something new! Well, new to me anyways!!!

There was a trend a few years ago, called “big memory” where people were encouraged to recombine many data-sharing members downwards so you went from a 14 way to eight way or six way to four way. This was then backed up with more DBATs and expanded buffer pools. The argument was pretty convincing: Let Db2 do the magic!

Too Much Work!

You, as a puny human, have no chance of really knowing what is going on. So just splitting the buffer pools at the highest possible level is all you can actually reasonably do! The argument went that it is easiest to go for around 9 – 10 buffer pools.

DISPLAY GROUPBUFFERPOOL Done on a Regular Basis?

Of course you do!!!

What I found out recently, is the ominous counter in message DSNB415I titled “PREFETCH DISABLED NO READ ENGINE”. Nowadays, each Db2 subsystem/member of a datasharing system has 900 read engines but before, it was split out in 14 or eight sub-systems and is now being used in far fewer.

Zero Counter No More!

This counter was *always* zero whenever and wherever I checked, until last week… Now I see PREFETCH DISABLED NO READ ENGINE on a regular basis. There is a great blog from Robert Catterall.

In the environments I am looking at, they also have PREFETCH DISABLED NO BUFFER occurrences and well over 100 I/Os /second, so it does indeed mean trouble!

Time to Tune!

All you can do here is:

  • Check your VPSEQT and see if you can nudge it up a bit.
  • Throw some memory at the problem by increasing the VPSIZE and hope that the requested pages are then found in the buffer pool.
  • Move smaller objects into PGSTEAL(NONE) buffer pools thus requiring no PREFETCH.
  • As a last gasp, try and tune the SQL to not use PREFETCH as a method – very tricky of course!

Keep on Truckin‘

But let’s be honest for a minute, if you have 900 read engines all humming along then your system is really running under pressure and you should *expect* to get this counter, I guess!

As Robert says: No need to panic!

TTFN,

Roy Boxwell

2024-06 Time for a change?

This month I wish to share an interesting voyage of discovery to do with TIMESTAMP calculations.

How Interesting …

It all started decades ago, when I wanted to find out how many microseconds there were between two timestamps. A simple idea for a trace in various programs which, when analyzed, could highlight problematic code paths.

Use DISPLAY Stupid!

Just DISPLAY the current timestamp at the start of each SECTION. The trace analysis program would then simply subtract two timestamps – et Voila! You have a difference!

Nope … That Fails

Well, I found out very quickly that math on TIMESTAMPs does *not* work like that! What you actually get is a “duration” which, in my humble opinion, is worthless! Here’s an example:

SELECT TIMESTAMP('2023-12-21-15.06.40.120234') -
       TIMESTAMP('2023-12-21-15.06.40.120034') 
FROM SYSIBM.SYSDUMMY1  ;                       
---------+---------+---------+---------+--------
---------+---------+---------+---------+--------
           .000200

Looks good doesn’t it? Exactly 200 microseconds – as it should be.

Now look at this example:

SELECT TIMESTAMP('2023-12-21-15.06.41.120234') -
       TIMESTAMP('2023-10-22-17.08.55.130234') 
FROM SYSIBM.SYSDUMMY1  ;                        
---------+---------+---------+---------+--------
---------+---------+---------+---------+--------
  129215745.990000

What?

Yep, what the calculation does is really “subtract”… What you get is a decimal 14 containing the YYYY (leading zeroes blanked of course!) years, MM months, DD days HHMMSS then a decimal point and then your usual six digits for microseconds.

Not Good!

This, for me, was not actually usable! So, what I did, was then extract all the fields multiplying by the different values and adding them all together to get a SECONDS field. This gave me what I wanted but was a bit messy.

Months?

Whoever dreamed up the western calendar obviously was not a programmer! 31, 30, 28 sometimes 29 days in a month but then not always… The days in month has been, and always will be, a real PITA. However, IBM Db2 has a nice Built-in Function (BiF) called DAYS (not DAY – That just extracts the day portion of the calendar!)

DAYS ( expression ) – The result is 1 more than the number of days from January 1, 0001 to D, where D is the date that would occur if the DATE function were applied to the argument.

All in UTC and this is *very* handy as it bypasses the days-in-the-month problem completely!

Armed with this it made the COBOL code simpler and better.

TIMESTAMPDIFF to the Rescue!

Then in Db2 V8 came a new BiF – TIMESTAMPDIFF – will it be our savior?

When it was announced I thought: Wow! This is great – it will do all the work for me – just tell it what you want as output and give it two timestamps and you are done!

TIMESTAMPDIFF( numeric-expression, string-expression)

Not Really …

The problem is in the first sentence of the docu that most people do not bother to read:

The TIMESTAMPDIFF function returns an estimated number of intervals of the type that is defined by the first argument, based on the difference between two timestamps.

Seconds is Good?

Naturally, I used 2 (to get seconds) as the numeric-expression and, to begin with, was a happy bunny with the results.

Guestimate?

Then I noticed that all was not well in the world of TIMSTAMPDIFF and that the “estimated” number can be difficult to judge! The problem gets clearer when you review the “assumptions” list at the end of the docu:

The following assumptions are used in estimating a difference:

  • One year has 365 days
  • One year has 52 weeks
  • One year has 12 months
  • One month has 30 days
  • One day has 24 hours
  • One hour has 60 minutes
  • One minute has 60 seconds

Now we all know that this is not true… Not all years have 365 days or even 52 weeks and nearly all months do not have 30 days! Now in my trace program it was just a bit irritating, but if you are using TIMESTAMPDIFF believing you really get the number of DAYS between two dates then it is time to think again!

Seeing is Believing

Here’s an example showing where it first works fine and then one day earlier and it all goes astray:

SELECT                                                              
 TIMESTAMPDIFF( 2, CHAR(TIMESTAMP('2023-12-21-00.00.01') -          
                        TIMESTAMP('2023-10-22-00.00.01')))  AS TSDIFF
,           DAYS(       TIMESTAMP('2023-12-21-00.00.01')) -         
            DAYS(       TIMESTAMP('2023-10-22-00.00.01'))   AS DAYS 
FROM SYSIBM.SYSDUMMY1  ;                                            
---------+---------+---------+---------+---------+---------+---------
     TSDIFF         DAYS                                             
---------+---------+---------+---------+---------+---------+---------
    5184000           60                                             
DSNE610I NUMBER OF ROWS DISPLAYED IS 1                              
SELECT                                                              
 TIMESTAMPDIFF( 2, CHAR(TIMESTAMP('2023-12-21-00.00.01') -          
                        TIMESTAMP('2023-10-21-00.00.01')))  AS TSDIFF
,           DAYS(       TIMESTAMP('2023-12-21-00.00.01')) -         
            DAYS(       TIMESTAMP('2023-10-21-00.00.01'))   AS DAYS 
FROM SYSIBM.SYSDUMMY1  ;                                            
---------+---------+---------+---------+---------+---------+---------
     TSDIFF         DAYS                                            
---------+---------+---------+---------+---------+---------+---------
    5184000           61                                            
DSNE610I NUMBER OF ROWS DISPLAYED IS 1

 As you can easily see, the day has changed by one but the TSDIFF has not…Not good! The problem is naturally caused by going over some internal threshold. If you do not care about accuracy, it is fine.

I Do!

So, what I have done is write my own “timestampdiff” in SQL:

SELECT                                                              
       MIDNIGHT_SECONDS(TIMESTAMP('2023-12-21-00.00.01')) -         
       MIDNIGHT_SECONDS(TIMESTAMP('2023-10-22-00.00.01'))           
      + ( 86400 * (DAYS(TIMESTAMP('2023-12-21-00.00.01')) -         
                   DAYS(TIMESTAMP('2023-10-22-00.00.01')))) AS DIFF 
,TIMESTAMPDIFF( 2, CHAR(TIMESTAMP('2023-12-21-00.00.01') -          
                        TIMESTAMP('2023-10-22-00.00.01')))  AS TSDIFF
,           DAYS(       TIMESTAMP('2023-12-21-00.00.01')) -         
            DAYS(       TIMESTAMP('2023-10-22-00.00.01'))   AS DAYS 
FROM SYSIBM.SYSDUMMY1  ;                                            
---------+---------+---------+---------+---------+---------+---------
       DIFF       TSDIFF         DAYS                               
---------+---------+---------+---------+---------+---------+---------
    5184000      5184000           60                               
DSNE610I NUMBER OF ROWS DISPLAYED IS 1                              
DSNE616I STATEMENT EXECUTION WAS SUCCESSFUL, SQLCODE IS 100         
---------+---------+---------+---------+---------+---------+---------
SELECT                                                              
       MIDNIGHT_SECONDS(TIMESTAMP('2023-12-21-00.00.01')) -         
       MIDNIGHT_SECONDS(TIMESTAMP('2023-10-21-00.00.01'))            
      + ( 86400 * (DAYS(TIMESTAMP('2023-12-21-00.00.01')) -         
                   DAYS(TIMESTAMP('2023-10-21-00.00.01')))) AS DIFF 
,TIMESTAMPDIFF( 2, CHAR(TIMESTAMP('2023-12-21-00.00.01') -          
                        TIMESTAMP('2023-10-21-00.00.01')))  AS TSDIFF
,           DAYS(       TIMESTAMP('2023-12-21-00.00.01')) -         
            DAYS(       TIMESTAMP('2023-10-21-00.00.01'))   AS DAYS 
FROM SYSIBM.SYSDUMMY1  ;                                            
---------+---------+---------+---------+---------+---------+---------
       DIFF       TSDIFF         DAYS                               
---------+---------+---------+---------+---------+---------+---------
    5270400      5184000           61                                
DSNE610I NUMBER OF ROWS DISPLAYED IS 1                              
DSNE616I STATEMENT EXECUTION WAS SUCCESSFUL, SQLCODE IS 100         
---------+---------+---------+---------+---------+---------+---------
SELECT                                                               
       MIDNIGHT_SECONDS(TIMESTAMP('2023-12-21-00.00.01')) -         
       MIDNIGHT_SECONDS(TIMESTAMP('2023-10-20-00.00.01'))           
      + ( 86400 * (DAYS(TIMESTAMP('2023-12-21-00.00.01')) -          
                   DAYS(TIMESTAMP('2023-10-20-00.00.01')))) AS DIFF 
,TIMESTAMPDIFF( 2, CHAR(TIMESTAMP('2023-12-21-00.00.01') -          
                        TIMESTAMP('2023-10-20-00.00.01')))  AS TSDIFF
,           DAYS(       TIMESTAMP('2023-12-21-00.00.01')) -         
            DAYS(       TIMESTAMP('2023-10-20-00.00.01'))   AS DAYS 
FROM SYSIBM.SYSDUMMY1  ;                                   
---------+---------+---------+---------+---------+---------+
       DIFF       TSDIFF         DAYS                       
---------+---------+---------+---------+---------+---------+
    5356800      5270400           62                      
DSNE610I NUMBER OF ROWS DISPLAYED IS 1

It all looks a lot better and actually returns the correct number of seconds between two timestamps!

How Does it Work?

The key part is just some math:

       MIDNIGHT_SECONDS(TIMESTAMP('from ts')) -         
       MIDNIGHT_SECONDS(TIMESTAMP('to ts'))           
      + ( 86400 * (DAYS(TIMESTAMP('from ts')) -         
                   DAYS(TIMESTAMP('to ts')))) AS DIFF

I use the MIDNIGHT_SECONDS BiF (First appeared in DB2 V6.1) that returns the number of seconds from midnight up to the given timestamp. I then simply subtract the “to ts” value from the „from ts“ value and then use the DAYS BiF again subtracting from each other to get the days difference multiplying by 86400 as seconds/day. There is no need to subtract an extra day as, if that was required, it is automatically handled by the MIDNIGHT_SECONDS subtraction. Then these two results are simply added together.

Code Review Time?

I have re-reviewed all my code to make sure that any use of TIMESTAMPDIFF can accept “approximate” answers and in all other cases replaced it with the above code.

I might even open an Aha! Idea about getting this as a BiF – it is not that complex and is “better” than the best guess system we have now. In fact, I have – DB24ZOS-I-1599 – please vote if you think it would be great to get this as a simple BiF!

Db2 Does Not Stand Alone Here!

We are also not alone in this problem! Oracle, MySQL and JAVA all have the same “approximation” routines. I did a Google search for a web-based timestamp calculator and it made exactly the same mistakes. I guess that there is a “fast algorithm” out there that does the best guess quickly…but sadly not accurately!

This problem is right up there with Daylight Saving Time and the grief that causes! See my earlier blog.

TTFN,

Roy Boxwell

2024-05 pre or co processor?

You pick your frame of reference and you pays your money, as they say!

Which way should we all be going these days? The good old precompiler, since the beginning of time, or the modern sleek coprocessor? This month, I will show you what they both do, what they do the same, what they do differently, and the pros and cons of both!

COBOL For All!

Yep, this newsletter is *just* about COBOL. Sorry if you use JAVA, Ruby, Python, or CosyPinkTeabags I stick with a language that works on computers so big you cannot lift ‘em!

In the Beginning…

Many, many moons ago, the great precompiler was launched. The problem was that Structured Query Language (SQL) is not COBOL in any way shape or form, but companies needed a way to integrate SQL code into COBOL code. The mainframe world had had this problem before with CICS, where the elegant solution was a CICS translator that ran through the code, removed all the special CICS calls, and replaced them with correctly formed COBOL calls. All done under the covers so that the application programmer did not have to know, or do, anything. CICS also now supports the integrated CICS translator by the way.

SQL was More Complicated

Naturally, the abilities in SQL caused some headaches… The syntax checking required the use of TABLE DECLARES (Still optional to this day, which I find astonishing!) To generate executable code the system had to do two things:

  1. Replace the EXEC SQL with comments and then calls to Assembler routines with parameters that listed out the SQL statement to be executed and all of the host variables involved. It also created a CONTOKEN or Consistency token that Db2 uses to check that any given load module “fits” to the given Package (DBRM) at run time.
  2. Output a DBRM, also with the CONTOKEN within it, so that then the PACKAGE/PLAN could be bound into an executable object. Every statement in the package matched the COBOL assembler calls one to one. At execution time, if the CONTOKEN in the package did not match the CONTOKEN in the load module, you would get a nasty error, typically an SQLCODE -805 with one of five sub-types, as something is wrong somewhere!

The Problem?

At the point where the precompiler was run, *no* COBOL had been compiled so any use of COPY books caused syntax errors – here the EXEC SQL INCLUDE jumped in to help *but* for, some unknown reason, they did not implement a REPLACING syntax like COPY has… This meant that the INCLUDEd code was not 100% the same as your “normal” COPY book – Very annoying!

Coprocess This!

This situation caused problems, and after a few years IBM launched the coprocessor which is basically the IBM COBOL compiler with the precompiler bolted within. This gave two immediate benefits:

  1. Simpler JCL (No precompiler step anymore!)
  2. Simpler COBOL copy book management as the COPY syntax worked fine!

So Why are We Not *All* Using the Coprocessor Today?

Well, as always, the devil is in the detail. The one major stopper I have seen is Db2 columns defined as “FOR BIT DATA”. Now, in the normal COBOL world, this just means “no code page conversion please.” The data is quite probably hexadecimal and will be completely mangled if it gets a code page conversion! What you actually get depends on what you are doing but it is quite easy to get an SQLCODE -333.

Unicode – EBCDIC – ASCII

The triumvirate of pain! If I had a dollar for every file transfer I have received that was originally EBCDIC and got ASCII transferred… but I digress!

There is a Fix!

There are two solutions here:

  1. Use a DECLARE VARIABLE in the code to “inform” the Compiler *not* to do a code page conversion when this COBOL host variable is being processed. This is naturally more work for the programmer and “dangerous” too, as it is another “point of failure” that never existed before! This scares people – we all hate change after all.
  2. Use NOSQLCCSID in the COBOL coprocessor parameters. This is recommended as the easiest way to stay plug compatible with the precompiler. Naturally, at some point, it will be time to bite the bullet and do the code change required!

The DECLARE you might need looks like this:

exec sql                                          
   declare :PACKAGE-CONTOKEN variable for bit data
end-exec

The problem is normally caused by INSERT and UPDATE processing. Just SELECT appears to always work fine in my tests, (I created an EBCDIC table and a UNICODE table and then did multiple Inserts and Selects with hex data). However, your data constellation might well be different from mine – Always test first!

Bottom Line

If you are not using FOR BIT DATA you have no problem!

Here’s a little SQL to show you where you have any columns with FOR BIT DATA in your system:

SELECT SUBSTR(STRIP(TBCREATOR) CONCAT '.' CONCAT STRIP(TBNAME)
            , 1 , 32) AS TABLE_NAME                          
     , NAME           AS COL_NAME                            
FROM SYSIBM.SYSCOLUMNS                                       
WHERE FOREIGNKEY = 'B'                                        
ORDER BY 1 , 2                                               
FOR FETCH ONLY                                               
WITH UR                                                      
;

JCL Changes Required

To get the Coprocessor up and running I just added these two lines into my SYSOPTF for COBOL 6.3:                            

,CODEPAGE(1141),NOSQLCCSID                            
,SQL("APOSTSQL ATTACH(CAF) COMMA DATE(ISO) TIME(ISO)")

Notice the NOSQLCCSID so I do not have to do any code changes!

Naturally, the STEPLIB must be enhanced:    

//STEPLIB   DD DISP=SHR,DSN=IGY630.SIGYCOMP    
//          DD DISP=SHR,DSN=DSND1A.SDSNEXIT.DD10
//          DD DISP=SHR,DSN=DSND1A.SDSNLOAD

And there are two new DD cards:

//DBRMLIB   DD DISP=SHR,DSN=SE.MDB2VNEX.TDBRM(COCOMP)
//SYSTERM   DD SYSOUT=*

That’s It!

All in all, I think if you are still using the precompiler you should take some time to migrate over to the coprocessor as it makes the modules much smaller and, by default, faster!

Faster? I Hear you Shout

Well, what the coprocessor also does, is completely remove all SQL based working storage and, most importantly, the PERFORM on the 1st call of the SQL-INITIAL section. Now the precompiler is clever but it is not Einstein! When the very first SQL gets called, this section is performed which defines in memory *all* the SQL in the program. So, let’s say you have a program with 1,000 SQLs. You are only using one of them, but for that one call all 1,000 working storage areas will be initialized through DSNHADDR and DSNHADD2 calls using the PLIST blocks. It is fast I know, but it is also just overhead!

Another Bonus!

Plus, if your COBOL is passing host variables through linkage section usage and the address changes between calls then you *must* currently reset the SQL-INIT-FLAG to zero *every* time… With the coprocessor you do not have to do that anymore – Another win!

Just the Facts Ma’am

In one of my test programs the precompiler generated:

1674 lines of working storage

232 lines of SQL-INITIAL code

For every EXEC SQL (31 in total) that was commented out a

PERFORM SQL-INITIAL UNTIL SQL-INIT-DONE
CALL 'DSNHLI2' USING SQL-PLIST11       
END-CALL

Block was written.

The coprocessor generated nothing! and the executable load module was 8% smaller!

Pros and Cons

Pros of precompiler are: No need to DECLARE for bit data columns and no JCL change.

Cons of precompiler are: No real COPY book support, larger code and bigger module size.

Pros of coprocessor are: No reset of SQL-INIT-FLAG, Perfect COPY book support, no generated code, smaller module size, faster run time execution and load.

Cons of coprocessor are: JCL change required and possible DECLARE VARIABLEs needed depending on usage.

What are your experiences with the precompiler and/or the coprocessor?

I would love to hear from you!

TTFN,

Roy Boxwell

2024-04 SCA you like?

This month, I must thank one of my readers who simply asked, “Roy, can you do a newsletter about the Shared Communications Area (SCA) for me please?” Naturally, I replied (after getting two beers from him of course!) So now I wish to delve into the inner workings of the Coupling Facility (CF) and the SCA…

Warning: Scary Stuff Ahead!

In a non-datasharing world, a -DISPLAY GROUP shows this sort of output:                                       

DSN7100I  -DD10 DSN7GCMD
*** BEGIN DISPLAY OF GROUP(........) CATALOG LEVEL(V13R1M504)
                  CURRENT FUNCTION LEVEL(V13R1M504)          
                  HIGHEST ACTIVATED FUNCTION LEVEL(V13R1M504)
                  HIGHEST POSSIBLE FUNCTION LEVEL(V13R1M504) 
                  PROTOCOL LEVEL(2)                          
                  GROUP ATTACH NAME(....)                    
---------------------------------------------------------------------
DB2          SUB                     DB2    SYSTEM    IRLM    
MEMBER   ID  SYS  CMDPREF   STATUS   LVL    NAME      SUBSYS IRLMPROC
-------- --- ---- --------  -------- ------ --------  ----   --------
........   0 DD10 -DD10     ACTIVE   131504 S0W1      IDD1   DD10IRLM
---------------------------------------------------------------------
SPT01 INLINE LENGTH:        32138                                   
*** END DISPLAY OF GROUP(........)                                  
DSN9022I  -DD10 DSN7GCMD 'DISPLAY GROUP ' NORMAL COMPLETION

If that is what you see in your production system, dear reader, then this newsletter is, sadly, not for you!

Hopefully your output actually looks like my little test system:

DSN7100I  -SD10 DSN7GCMD                                             
*** BEGIN DISPLAY OF GROUP(GSD10C11) CATALOG LEVEL(V13R1M504)       
                  CURRENT FUNCTION LEVEL(V13R1M504)                 
                  HIGHEST ACTIVATED FUNCTION LEVEL(V13R1M504)       
                  HIGHEST POSSIBLE FUNCTION LEVEL(V13R1M504)        
                  PROTOCOL LEVEL(2)                                 
                  GROUP ATTACH NAME(SD1 )                           
---------------------------------------------------------------------
DB2          SUB                     DB2    SYSTEM    IRLM          
MEMBER   ID  SYS  CMDPREF   STATUS   LVL    NAME      SUBSYS IRLMPROC
-------- --- ---- --------  -------- ------ --------  ----   --------
MEMSD10    1 SD10 -SD10     ACTIVE   131504 S0W1      JD10   SD10IRLM
MEMSD11    2 SD11 -SD11     ACTIVE   131504 S0W1      JD11   SD11IRLM
---------------------------------------------------------------------
SCA   STRUCTURE SIZE:    16384 KB, STATUS= AC,   SCA IN USE:     3 %
LOCK1 STRUCTURE SIZE:    16384 KB                                   
NUMBER  LOCK ENTRIES:     4194304                                   
NUMBER  LIST ENTRIES:       16354, LIST ENTRIES  IN USE:          81
SPT01 INLINE LENGTH:        32138                                    
*** END DISPLAY OF GROUP(GSD10C11)                                  
DSN9022I  -SD10 DSN7GCMD 'DISPLAY GROUP ' NORMAL COMPLETION

The interesting stuff is from the “SCA   STRUCTURE SIZE:” line down to the “NUMBER  LIST ENTRIES:” line.

Off We Go!

To understand what an SCA is, we need to backtrack a second and first discuss what a CF is?

What is Inside?

The Coupling Facility is de facto *the* central part of data sharing, it contains three objects:

  1. A lock structure called LOCK1, where all the table locks using hashes live, and Record Lock Elements (RLE),
  2. A list structure that is actually the SCA, which contains a bunch of stuff I will go into later,
  3. The Group Buffer pools. Technically, you can run without these but then why are you data sharing if you are not sharing data?

Lock Structure Details

It is called LOCK1 and the system lock manager (SLM) uses the lock structure to control shared Db2 resources like tablespaces and pages and can enable concurrent access to these. It is split internally into two parts: The first part is the Lock Table Entry (LTE), and the second part is a list of update locks normally actually called the Record List Entry (RLE). The default is a 50:50 split of memory. The size of this structure must be big enough to avoid hash contention, which can be a major performance problem. Do not forget that the IRLM reserves 10% of the RLEs for “must complete” processes so you never actually get to use them all!

List Structure Details

This is really the SCA and it contains Member names, BSDS names, Data Base Exception Table (DBET) statuses and recovery information. Typically, at installation time, you pick a number for the INITSIZE (first allocated size of the SCA) from a list of 16 MB , 32 MB, 64 MB or 128 MB. Each of these INITSIZEs then has a SIZE which is typically twice the INITSIZE size as a maximum limit.

Baboom!

IBM write quite happily “Running out of SCA space can cause Db2 to fail” – I can change that to “does” not “can”!

Double Trouble?

The LOCK1 and the SCA do *not* have to be duplexed but it is very highly recommended to do so, otherwise, you have a single point of failure which defeats the whole point of going data sharing, really.

Death by DBET

The DBET data is, strangely enough, the thing that can easily kill ya!

How So?

Imagine you have the brilliant idea of using COPY YES indexes as you have tested a few and seen that RECOVER INDEX is quicker, better, faster than REBUILD or DROP/CREATE for the critical indexes at your shop.

What Happened Next?

So how do you enable COPY YES at the index level? Just a simple ALTER INDEX xxx.yyy COPY YES is all it takes. But *what*, dear friends, does this ALTER do under the covers? It sets the INDEX to ICOPY status – „Not too bad“, you say as the index is fully available, „just wait until the next COPY and that status is then cleared“ – But wait, that is a DBET status! It creates a DBET entry in your SCA… What if you alter 15,000 Indexes to all be COPY YES? Yep – Kiss goodbye to your Db2 sub-system!

Suicide Protection

Some software out there (RealTimeDBAExpert from SEGUS for example!) actually warns you about this and recommends you do this sort of thing in chunks. First the ALTER, then the COPY, one hundred blocks at a time and then the next batch etc.

and then if you do press PF1:

And even then, we have an emergency stop built-in that you can still override but then you must *know* the possible risk involved:

On the other hand, some software is like using SDSF DA when you put a P for “print” by your userid!

Now you know what *not* to do!

Automagic?

Use of the ALLOWAUTOALT(YES) has been discussed for years… on the one hand it automagically adds storage if you are running out, which is a good thing, *but* it also allows other competing systems to decrease storage which can then lead to you running out of storage and losing this Db2 sub-system… nasty, nasty!

Operator command time!

/f <yourirlm>,STATUS,STOR

Gives me:

DXR100I JD11002 STOR STATS
PC: YES  LTEW:  2 LTE:     4M RLE:   16354  RLEUSE:      18        
BB PVT:  1266M  AB PVT (MEMLIMIT):   2160M                         
CSA USE: ACNT:     0K  AHWM:     0K  CUR:  2541K  HWM:  6122K      
        ABOVE 16M:    64   2541K     BELOW 16M:     0      0K      
        AB CUR:               0K     AB HWM:               0K      
PVT USE:   BB CUR:  5684K        AB CUR:     5M                    
           BB HWM:    18M        AB HWM:     5M                    
CLASS   TYPE  SEGS     MEM   TYPE  SEGS     MEM   TYPE  SEGS     MEM
ACCNT    T-1     2      4M    T-2     1      1M    T-3     2      8K
PROC     WRK    14     70K    SRB     5      5K    OTH     4      4K
MISC     VAR    41   7549K    N-V    22    565K    FIX     1     24K

This maps pretty nicely to the – DISPLAY GROUP I just did again:

*** BEGIN DISPLAY OF GROUP(GSD10C11) CATALOG LEVEL(V13R1M504)       
                  CURRENT FUNCTION LEVEL(V13R1M504)                 
                  HIGHEST ACTIVATED FUNCTION LEVEL(V13R1M504)       
                  HIGHEST POSSIBLE FUNCTION LEVEL(V13R1M504)        
                  PROTOCOL LEVEL(2)                                 
                  GROUP ATTACH NAME(SD1 )                           
---------------------------------------------------------------------
DB2          SUB                     DB2    SYSTEM    IRLM          
MEMBER   ID  SYS  CMDPREF   STATUS   LVL    NAME      SUBSYS IRLMPROC
-------- --- ---- --------  -------- ------ --------  ----   --------
MEMSD10    1 SD10 -SD10     ACTIVE   131504 S0W1      JD10   SD10IRLM
MEMSD11    2 SD11 -SD11     ACTIVE   131504 S0W1      JD11   SD11IRLM
---------------------------------------------------------------------
SCA   STRUCTURE SIZE:    16384 KB, STATUS= AC,   SCA IN USE:     3 %
LOCK1 STRUCTURE SIZE:    16384 KB                                   
NUMBER  LOCK ENTRIES:     4194304                                   
NUMBER  LIST ENTRIES:       16354, LIST ENTRIES  IN USE:          18
SPT01 INLINE LENGTH:        32138                                   
*** END DISPLAY OF GROUP(GSD10C11)

Looking at this line in the Modify output:     

PC: YES  LTEW:  2 LTE:     4M RLE:   16354  RLEUSE:      18        

I only have two members so my LTEW (LTE Width) is two bytes, LTE is 4M which is my NUMBER LOCK ENTRIES: 4194304 , RLE is 16354 which is my NUMBER LIST ENTRIES: 16354 and RLEUSE is 18 which is my LIST ENTRIES IN USE: 18. A perfect match – if only they had agreed on a naming convention! ! !

You can also see that my SCA STATUS is AC for ACTIVE and the SCA IN USE is a measly 3%, so no worries for me today!

Finally, you can see that we have 50:50 split as the SCA and the LOCK1 are the same size: 16 MB.

One more line of interest:                  

BB PVT:  1266M  AB PVT (MEMLIMIT):   2160M       

Here you can see the calculated MEMLIMIT for the IRLM, which for my test system is very low, but you should check that the number is good for your site as the range is now much bigger!

Panic Time?

I would start to get seriously sweaty if the SCA IN USE ever got near 70%.

And?

I would not use ALLOWAUTOALT(YES) and allocate 256MB or, if forced, I would go with INITSIZE 128 MB and SIZE 256 MB and then ALLOWAUTOALT(YES).

Lock it Down!

The Max Storage for locks is between 2,048 MB and 16,384 PB with a default of 2,160 MB that I have in the PVT (MEMLIMIT) output above.

Locks per table(space) (NUMLKTS) is 0 to 104,857,600 with a default of 2,000 in Db2 12 and 5,000 in Db2 13. If this number is exceeded then lock escalation takes place unless it is zero in which case there is no lock escalation. As IBM nicely put it “Do not set the value to 0, because it can cause the IRLM to experience storage shortages”.

Locks per user (NUMLKUS) is also from 0 to 104,857,600 with a default of 10,000 in Db2 12 and 20,000 in Db2 13. 0 means no limit. IBM do not recommend 0 or a large number here unless it is really required to run an application. Db2 assumes that each lock is approximately 540 bytes of memory. Here you can also drain your IRLM until it runs out of ACCOUNT T-1 storage space:

DXR175E xxxxxxxx IRLM IS UNABLE TO OBTAIN STORAGE – PVT

This is not a message you ever want to see on the master console! Just do the math on your locks and your memory size!

The Bachelor Problem – Fear of Commitment

You must get the developers to COMMIT or not use row-level locking everywhere.

SCA DBET Calculation

The lock size for each DBET entry is approximately 1,864 bytes from my tests in Db2 12 FL 510. How did I determine that, you ask?

What I did, was multiple ALTER INDEX aaa.bbb COPY YES SQLs until the „SCA in use“ percentage changed from 4% to 5%, and then I kept doing ALTERs and DISPLAYs until the percentage changed from 5% to 6%. It took me exactly 90 ALTERs and with an SCA size of 16,384KB, that gives me a size of around 1,864 bytes per DBET entry. Use this as a Rule Of Thumb for your DBET inducing ALTERs! It gives me a hard limit of about 6,000 Alters.

I hope you found this little discourse into the world of the Coupling Facility and SCA useful!

TTFN,

Roy Boxwell

2024-03 I am fine, up to a certain DEGREE

This month is all about going parallel! In the Db2 world, we have had the ability to run SQLs using parallel processing for decades. It started off a bit wobbly and most people didn’t use it, or even like it, but these days it is extremely useful for certain cases.

Sort Yourself Out

Sort is very important here. If you can do a parallel sort with only one extra parallel task it will halve your elapsed time… if you can add more tasks it takes even less elapsed. Naturally, you do not save on CPU here, in fact it will probably “cost” more, but you are trading CPU for elapsed time.

Ground Rules

IBM states in the documentation that parallel processing is “Only for partitioned objects” but then they mention that even non-partitioned objects can benefit, as the access to the non-clustering index and the data can be done in parallel… which is not helpful if you only have clustering index access, of course!

Bells and Whistles!

There are quite a few things to adjust and play with on the road to parallel processing!

No Way!

If you declare your cursor as WITH HOLD and with isolation level RR or RS then there is *no* CPU parallelism allowed at all but you can still get parallel sorts.

ZPARM Time

First up is CDSSRDEF (CURRENT DEGREE) where the IBM recommendation must be read:

CURRENT DEGREE field (CDSSRDEF subsystem parameter)

The CDSSRDEF subsystem parameter determines the default value that is to be used for the CURRENT DEGREE special register. The default value is used when a degree is not explicitly set in the SQL statement SET CURRENT DEGREE.

Acceptable values: 1, ANY

Default: 1

Update: option 30 on panel DSNTIPB

DSNZPxxx: DSN6SPRM CDSSRDEF

1 Specifies that when a query is dynamically prepared, the execution of that query will not use parallelism. If this value is specified, Db2 does not use any optimization hints for parallelism.

ANY Specifies that when a query is dynamically prepared, the execution of that query can involve parallelism.

Recommendation: In almost all situations, accept the default value of 1. You should use parallelism selectively where it provides value, rather than globally. Although parallelism can provide a substantial reduction in elapsed time for some queries with only a modest overhead in processing time, parallelism does not always provide the intended benefit. For some queries, and in many other situations, query parallelism does not provide an improvement, or it uses too many resources. If you are using nearly all of your CPU, I/O, or storage resources, parallelism is more likely to cause degradation of performance. Use parallelism only where it is most likely to provide benefits.

The ZPARM INDEX_IO_PARALLELISM should get an honorable mention here as it was there right up until Db2 11 and it is, in fact, still within the Db2 12 and 13 indexes at the end of the installation guide pdf, but it has thrown off its mortal coil…

INDEX_IO_PARALLELISM

Specifies whether I/O parallelism is enabled for index insertion.

Acceptable values: YES, NO

Default: YES

DSNZPxxx: DSN6SPRM INDEX_IO_PARALLELISM

Security parameter: No

YES I/O parallelism is enabled for index processing. I/O parallelism allows concurrent insert operations on multiple indexes and can reduce I/O wait time when many indexes are defined in a table.

NO I/O parallelism is disabled for index processing.

Naturally, YES is what it should be set to!

To round out the dearly departed, there was also this one:

PARALLELISM EFFICIENCY field (PARA_EFF subsystem parameter)

Controls the efficiency that DB2 assumes for parallelism when DB2 chooses an access path. Valid values are integers 0 – 100. The integer represents a percentage efficiency.

It came in Db2 9 with PM16020 and started life with a default value of 100 before getting a default change to 50 in Db2 10. It got deprecated in Db2 12 and was removed in Db2 13.

Then PARAMDEG with a handy Top Tip:

MAX DEGREE field (PARAMDEG subsystem parameter)

The PARAMDEG subsystem parameter specifies the maximum degree of parallelism for a parallel group. When you specify a non-zero value for this parameter, you limit the degree of parallelism so that Db2 cannot create too many parallel tasks that use virtual storage.

Acceptable values: 0 – 254

Default: 0

Update: option 30 on panel DSNTIPB

DSNZPxxx: DSN6SPRM PARAMDEG

0 Specifies no limit to the maximum degree of parallelism that Db2 chooses based on the cost estimate for the query and the system configuration, in particular the number of processors online. Db2 counts both general purpose and zIIP processors equally, and applies further adjustment to determine the degree to use.

1 – 254 Specifies the maximum degree of parallelism that Db2 uses. When optimization hints for parallelism are used, the value of the PARAMDEG subsystem parameter does not limit the degree of parallelism at bind time. However, the value of the PARAMDEG subsystem parameter is enforced at execution time. So, if the value of the PARAMDEG subsystem parameter is lower than the degree of parallelism that is specified at bind time, the degree of parallelism is reduced at execution time.

Tip: For systems with more than two zIIP processors configured, use the number of zIIP processors as the starting value, and then adjust as needed for your response time requirements.

Basically, set this value to be one or two times the number of online available CPUs but take into account the ZiiPs.

Then its new DPSI baby brother:

MAX DEGREE FOR DPSI (PARAMDEG_DPSI subsystem parameter)

The PARAMDEG_DPSI subsystem parameter specifies the maximum degree of parallelism that you can specify for a parallel group in which a data partitioned secondary index (DPSI) is used to drive parallelism.

A DPSI is a non-partitioning index that is physically partitioned according to the partitioning scheme of the table. When you specify a value of greater than 0 for this parameter, you limit the degree of parallelism for DPSIs so that Db2 does not create too many parallel tasks that use virtual storage.

Acceptable values: 0-254, DISABLE

Default: 0

Update: option 30 on panel DSNTIPB

DSNZPxxx: DSN6SPRM PARAMDEG_DPSI

Data sharing scope: All members use the same setting

0 Specifies that Db2 uses the value that is specified for the PARAMDEG subsystem parameter, instead of PARAMDEG_DPSI, to control the degree of parallelism when DPSI is used to drive parallelism. This is the default value for the field.

1 Specifies that Db2 creates multiple child tasks but works on one task at a time when DPSI is used to drive parallelism.

2-254 Specifies that Db2 creates multiple child tasks and works concurrently on the tasks that are specified. The number of specified tasks may be larger or smaller than the number of tasks as specified in PARAMDEG. When PARAMDEG is set to 1, the rest of the query does not have any parallelism.

DISABLE Specifies that Db2 does not use DPSI to drive parallelism. Parallelism might still occur for the query if PARAMDEG is greater than 1.

This is for fine-tuning the DPSI use case. Remember, you can have 4096 partitions and so it could well be that a query goes crazy if it sees the ability to go massively parallel. Here you can limit, or even inhibit, that from happening. Only use if you have been bitten by a rogue SQL!

Then we get to Utility parallel processing which is not for all Utilities – but REORG TABLESPACE and COPY are there!

MAX UTILS PARALLELISM field (PARAMDEG_UTIL subsystem parameter)

The PARAMDEG_UTIL subsystem parameter specifies the maximum number of parallel subtasks for some utilities.

PARAMDEG_UTIL affects the following utilities:

• REORG TABLESPACE

• REBUILD INDEX

• CHECK INDEX

• UNLOAD

• LOAD

• COPY

• RECOVER

Acceptable values: 0 – 32767

Default: 99

Update: option 34 on panel DSNTIPB

DSNZPxxx: DSN6SPRM PARAMDEG_UTIL

0 No additional constraint is placed on the maximum degree of parallelism in a utility.

1 – 32767 Specifies the maximum number of parallel subtasks for all affected utilities.

Interesting default huh? In Db2 11 it was actually zero!

LOAD must get a special mention here, as back in Db2 11 it got a new keyword PARALLEL
( nnn ) which enabled parallel loading from a *single* input file (Initially not for PBGs but then that was allowed in Db2 12). This little chestnut has often been forgotten.

Further into the guts of REORG is this little one:

REORG LIST PROCESSING field (REORG_LIST_PROCESSING subsystem parameter)

The REORG_LIST_PROCESSING subsystem parameter specifies the default setting for the PARALLEL option of the Db2 REORG TABLESPACE utility.

Acceptable values: PARALLEL, SERIAL

Default: PARALLEL

Update: option 37 on panel DSNTIPB

DSNZPxxx: DSN6SPRM REORG_LIST_PROCESSING

PARALLEL The default value PARALLEL specifies that the REORG TABLESPACE utility is to use a default PARALLEL YES option when the PARALLEL keyword is not specified in the utility control statement. The PARALLEL YES option specifies that the REORG TABLESPACE utility is to process all partitions that are specified in the input LISTDEF statement in a single execution of the utility.

SERIAL Specifies that the REORG TABLESPACE utility is to use a default PARALLEL NO option when the PARALLEL keyword is not specified in the utility control statement. The PARALLEL NO option specifies that each partition that is specified in the input LISTDEF statement is to be processed in a separate execution of the utility.

I would also happily stick with the default unless you have experienced serious problems with VTS or some such.

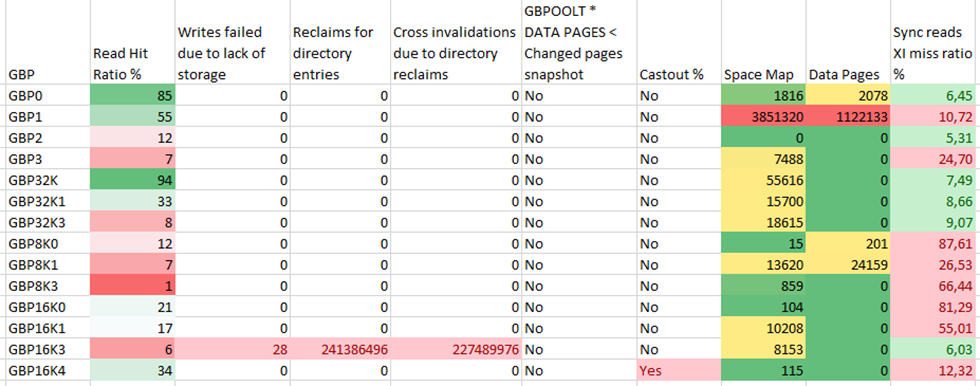
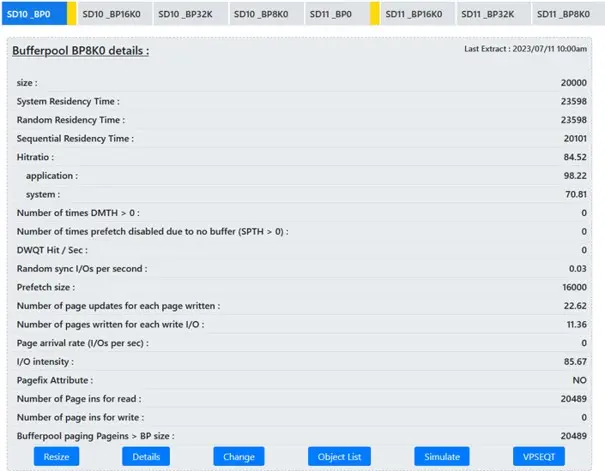
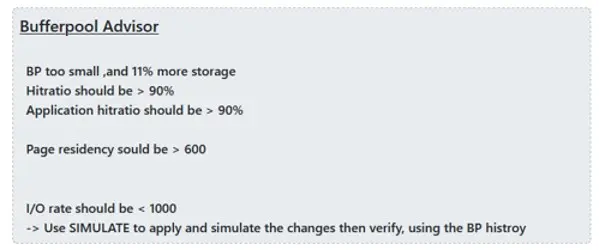
Don’t Forget the Bufferpool, Stupid!

BUFFERPOOLs play a major role. The setting of VPSEQT (Virtual bufferpool sequential steal threshold) and VPPSEQT (Virtual bufferpool parallel sequential threshold) might well both have to be raised. Remember that the VPPSEQT is a percentage of the VPSEQT available pages. The bufferpool size itself might well have to be raised (VPSIZE) if you do not see an improvement in the degree of parallelism.

All Ready?

So, you have set, checked, reviewed, changed the ZPARMS and are ready to go?

Where’s the ON Switch?

For Static SQL just bind or rebind with DEGREE(ANY), for dynamic SQL issue a

SET CURRENT DEGREE = ‘ANY’ ;

CDSSRDEF Zparm has the default for this parameter.

If you bind with isolation level CS, then also try and make sure you use CURRENTDATA(NO) as well. This helps performance anyway and also aids Db2 in working with ambiguous cursors. Explicit read-only is always better!

For sorts, where the big elapsed time gains come from, make sure you have sufficiently sized work files allocated! Here, even the WITH HOLD and isolation RR or RS can benefit.

Gotchas?

Always at least one problem isn’t there? If you do DEGREE(ANY) you can expect the EDMPOOL usage to go up between 50% and 70% due to run-time structures. Check your SYSPACKAGE AVGSIZE before and after the BIND/REBIND if you are worried. Always monitor this pool and make sure it is correctly sized for your workload!

Naturally, the CPU might well go up but you should see a good drop in elapsed times and, as far as sort is concerned, you might actually manage a successful parallel sort in a normally constrained sub-system!

Where’s the OFF Switch?

For Static SQL just bind or rebind with DEGREE(1), for dynamic SQL issue a

SET CURRENT DEGREE = ‘1’;

This is also the default value but what if someone changed your default?

If you shrink the VPPSEQT to 0 that will disable all parallel access for objects in that bufferpool.

Insert rows in the resource limit tables – Not recommended as this is a lot of work!

Are You Running in Parallel then? EXPLAIN is Your Friend!

There are a few “access patterns” that allow CP parallelism and they are all documented in the Managing Performance book – “Checklist of query restrictions for query CP parallelism” table.

How do You Check?

The columns of interest in the PLAN_TABLE are the ACCESS_DEGREE and JOIN_DEGREE. If either of these two is not NULL then you are using, or hoping to use, parallel processing! The moment you have more than one table then four other columns become interesting: ACCESS_PGROUP_ID, JOIN_PGROUP_ID, SORTN_PGROUP_ID and SORTC_PGROUP_ID. PGROUP is short for PARALLEL GROUP and for a given PLANNO step they all have the same number. Finally, the PARALLELISM_MODE reflects which type you are using which, these days, can *only* be ‘C’ for Query CP parallelism (Came in DB2 V4). It used to also have the values ‘I’ for parallel I/O operations (Came in DB2 V3)  and ‘X’ for Sysplex query parallelism (Came in DB2 V5) but they were deprecated in Db2 9 and are now both dead and buried!

Which SQLs are Best for Parallel Processing?

SQLs that are I/O intensive and scan lots of pages while returning just a few rows, SQLs that have lots of aggregate functions, and naturally SQLs that require Sort – all of these are good candidates.

Trial it DUMMY!

Best thing to do is a trial rebind to a dummy collection of all your SQL in a sandbox system with production statistics copied over and with parallel processing enabled (Do not forget the bufferpools!). This will then quickly reveal which queries could indeed benefit from going parallel and enable you to activate it only at the package/SQL level that you require in production.

Apply and Test

Once you have your candidate list, and I hope it is not that long, you can simply enable it all in production and do a live run through and review. First with EXPLAIN and then really live.

Remember that it is not good for *all* SQLs but it can really help when it hits the spot!

My Favorite Table Ever!

Db2 11 introduced an automatic five level control system for parallel queries:

Level 1 OK: Query runs with planned parallel degree

Level 2 Mild warning: Reduce parallel degree by ¼

Level 3 Moderate warning: Reduce parallel degree by ½ or to degree 2

Level 4 Severe warning: Reduce to sequential run

Level 5 Melt down: Reduce to sequential run

Level 5 is sub-optimal!

The original table is here: (Do a search for „Melt“)

https://www.redbooks.ibm.com/redbooks/pdfs/sg248222.pdf

How to Tame the Beast?

For static SQL, just bind/rebind with DEGREE(1) to switch off or DEGREE(ANY) to switch on.

For dynamic SQL, if you cannot add the SET CURRENT DEGREE = ‘ANY’ and RLF tables do not work for you then the only way is to assign the tables in question to their own bufferpools and set the VPPSEQT to a value, or leave at default 50, and for *all* other bufferpools set the VPPSEQT to 0 which switches off parallel processing.

Another way of handling dynamic, but a bit over the top for my taste, is a new data-sharing member where the ZPARM CDSSRDEF is set to ‘ANY’. Then any dynamic work that should be allowed to go parallel is simply routed to just this member.

Whaddya all think?

Going to start testing out parallel processing anytime soon?

I’d love to hear from you!

TTFN

Roy Boxwell

Feedback:

One of my readers mentioned that the primary reason they use parallelism is to increase zIIP offload which offers not just elapsed reduction but also saves the cost of the cpu as well.

Naturally, if you get this, then you are really laughing all the way to the bank!

2024-02 BUFFER POOL You too!

Hi all! This month, I would like to share some things that I have recently learned about Db2 for z/OS buffer pool management and tuning as there was some chatter on Listserv about the sizing of buffer pools.

It all started with some Freeware…

Well actually my freeware! SEG created a BPOOL check freeware program to do a quick analysis of your local and group buffer pools. This freeware you can download here is based upon the rules of our new SQL WorkloadExpert (WLX) Buffer pool Use Case where WLX checks and recommends changes to your buffer pools as well as generating the ALTERs you need.

Readers responded

What we saw, after looking at the responses, was *all* sites have buffer pool problems and are not even aware of them!

Bigger is Better!

Well, actually, no … Dan Luksetich and John Campbell had a conversation a few years ago about the topic of “When is too big too bad?” The basic rub of the matter was this:

“LRU chains (queues, whatever you want to call them) are initially allocated at 4,000 pages. For small pools, the chains are allocated as needed, up to 255 chains. Then once you are over 1,020,000 pages, the chains grow in size. At about 800GB to 1TB the user starts to see CPU go up as management of the longer chains becomes excessive. … In addition, if you have a very large pool, you’ll want to set VDWQT and DWQT very low. I have VDWQT at 0,128 for some large pools and others at 1%.”

One Big Pool Or …

So, if you had decided to get monolithic on your BP definitions, it might well be time to do a quick rethink and spread the load across multiple largish (up to 800 GB) buffer pools.

Do Not Forget the DWQTs!

We should not be forgetting to take care of DWQT and its vertical assistant, the VDWQT, with its two values – Just percentage of the buffer pool or, after a comma, an absolute number of pages going up to 9999. These two values are specifically designed for large buffer pools where 1% just doesn’t hack it as a trigger for deferred write. Imagine our example buffer pool before with 1,020,000 pages – 1% is still a huge 10,200 pages!

Why Do We Have Buffer Pools?

Remember, the point of buffer pools is to stop I/O and so trickling these updates out instead of hammering them out is definitely a good way forward!

Seeing is Believing!

Do a few -DISPLAY BUFFERPOOL(xxx) DETAIL(*) commands (obviously replacing xxx with your buffer pool of choice) and check out the counters in the DSNB421I message. If you also compute how long the buffer pool has been active, or you do two commands separated by a known amount of time ,you can then simply calculate /sec values.  If you are getting more than 1 DWT HIT per second then it is time to act. Same is true for VERTICAL DWT HIT but you can afford to get more of these than the DWT HIT ones!

Groups are Good?

You always get a good feeling traveling in a group, and theoretically, it should be the same with GROUP BUFFERPOOLS, as these beasts control the buffer pool usage between members in a data-sharing system. Normally, they are set up and then simply forgotten about! After all, if all is working who cares?

How Does it Look?

Here’s the output of a post processed by me in Excel, -DIS GROUPBUFFERPOOL(*) TYPE(GCONN) GDETAIL(*) MDETAIL(*) command:

Not good!

We all know that the Read Hit Ratio % can basically be ignored at the group level so that’s ok.

But glance down at GBP16K3 – Storage problems, massive reclaims and cross invalidations aplenty. This group buffer pool *must* be examined under the microscope!

The Db2 Guru Says

John Campbell commented:

“It is possible that the reference to updated data across members is very low. But if the miss ratio is elevated across most of the GBPs this not a likely explanation. If check that there no directory entry reclaims causing XIs. These should be tuned away first ie increase INITSIZE and RATIO. Then go after tuning to reduce XI misses by increasing INITSIZE. In both cases rebuild of respective GBP will be required.”

Just the Facts Ma’am

In this case, the first thing is to ratify the RATIO and INITSIZE.

  • Size of all local BPs for BP16K3 is 40,000 pages
  • Current directory to data ratio is 10
  • Allocated size is 65536, so 64 MB
  • Number of directory entries is 30,771
  • Number of data pages is 3,076

From this you can derive* that the starting size (INITSIZE) of GB16K3 should be increased to at least 89 MB, which then gives 44,445 Directory entries and 4,445 data pages.

Monitor Monitor Monitor

Once this change has been implemented the GBPs must be monitored to see if RATIO could/should be changed. Then check out that the Writes failed, Reclaims for directory and especially the Cross-Invalidation counters all go down!

A Little Tweak Can Work Wonders!

Buffer pool tuning is not new and will never go away, but you can get very good system-wide improvements with a few well aimed tweaks!

TTFN.

Roy Boxwell

* When I say „derive“ what I meant is:

Add up all the Local BPs VPSIZE for each member -> A (directory entries)

Divide this number by the RATIO and round up -> B (data entries required for above directories)

Divide this number by the RATIO and round up -> C (directory entries)

Divide this number by the RATIO and round up -> D (data entries required for above directories)

Iterate until the value is less than RATIO and then use the value -> 1

Add *all* of the numbers A, B, C, D, E … to get total number of directory entries NNNNN

Multiply NNNNN by 430 (size of a directory entry) and then divide by 1048576 rounding up, to get the size of the Directory Entries OOOOO in MB

Divide NNNNN by the RATIO rounding up, to get the total number of Data Entries required, then multiply this by the Bufferpool size in K (4, 8, 16 or 32) and divide by 1024 rounding up to get the size of the Data Entries MMMMM in MB

Add MMMMM and OOOOO to get the recommended GBP starting size in MB.

Compare with DSNB758I ALLOCATED SIZE KB / 1024

Easy going, huh? 🙂

2024-01 Happy New SQLCODE!

Aren’t I supposed to be wishing Happy New Year there? Not this month! One of my readers asked me a question about SQLCODEs and it opened up a quite fascinating can of worms!

What is the SQLCODE?

Anyone reading this blog should already know exactly what the SQLCODE is, however, for those of you out there using Google in 2045, the definition is, at least in COBOL:

01 SQLCA.
   05 SQLCAID     PIC X(8).
   05 SQLCABC     PIC S9(9) COMP-5.
   05 SQLCODE     PIC S9(9) COMP-5.
   05 SQLERRM.
      49 SQLERRML PIC S9(4) COMP-5.
      49 SQLERRMC PIC X(70).
   05 SQLERRP     PIC X(8).
   05 SQLERRD     OCCURS 6 TIMES
                  PIC S9(9) COMP-5.
   05 SQLWARN.
      10 SQLWARN0 PIC X.
      10 SQLWARN1 PIC X.
      10 SQLWARN2 PIC X.
      10 SQLWARN3 PIC X.
      10 SQLWARN4 PIC X.
      10 SQLWARN5 PIC X.
      10 SQLWARN6 PIC X.
      10 SQLWARN7 PIC X.
   05 SQLEXT.
      10 SQLWARN8 PIC X.
      10 SQLWARN9 PIC X.
      10 SQLWARNA PIC X.
      10 SQLSTATE PIC X(5).

The third field within the SQLCA is the SQLCODE, which is a four-byte signed integer and it is filled after every SQL call that a program/transaction makes.

All Clear So Far?

So far so good! In the documentation from IBM is this paragraph about how to handle and process SQLCODEs:

SQLCODE

Db2 returns the following codes in SQLCODE:

• If SQLCODE = 0, execution was successful.

• If SQLCODE > 0, execution was successful with a warning.

• If SQLCODE < 0, execution was not successful.

SQLCODE 100 indicates that no data was found.

The meaning of SQLCODEs, other than 0 and 100, varies with the particular product implementing SQL.

Db2 Application Programming and SQL Guide

So, every programmer I have ever talked to checks if the SQLCODE is 0 – Green! Everything is fine, if the SQLCODE is negative – Bad message and ROLLBACK, if the SQLCODE is +100 – End of cursor or not found by direct select/update/delete – normally 100% Ok, everything else issues a warning and is naturally very dependent on the application and business logic!

What’s Wrong With This Picture?

Well, sometimes zero is not really zero… I kid you not, dear readers! The sharp-eyed amongst you, will have noticed the last bytes of the SQLCA contain the SQLSTATE as five characters. Going back to the documentation:

An advantage to using the SQLCODE field is that it can provide more specific information than the SQLSTATE. Many of the SQLCODEs have associated tokens in the SQLCA that indicate, for example, which object incurred an SQL error. However, an SQL standard application uses only SQLSTATE.

So, it still seems fine, but then it turns out that SQLCODE 0 can have non-all zero SQLSTATEs!

New in the Documentation

At least for a few people this is a bit of a shock. From the SQLCODE 000 documentation:

SQLSTATE

  • 00000 for unqualified successful execution.
  • 01003, 01004, 01503, 01504, 01505, 01506, 01507, 01517, or 01524 for successful execution with warning.

Say What?

Yep, this is simply stating that you have got an SQLCODE 0 but up to nine different SQLSTATEs are possible… This is not good! Most error handling is pretty bad, but now having to theoretically add SQLSTATE into the mix makes it even worse!

What are the Bad Guys Then?

01003 Null values were eliminated from the argument of an aggregate function.

01004 The value of a string was truncated when assigned to another string data type with a shorter length.

01503 The number of result columns is larger than the number of variables provided.

01504 The UPDATE or DELETE statement does not include a WHERE clause.

01505 The statement was not executed because it is unacceptable in this environment.

01506 An adjustment was made to a DATE or TIMESTAMP value to correct an invalid date resulting from an arithmetic operation.

01507 One or more non-zero digits were eliminated from the fractional part of a number used as the operand of a multiply or divide operation.

01517 A character that could not be converted was replaced with a substitute character.

01524 The result of an aggregate function does not include the null values that were caused by evaluating the arithmetic expression implied by the column of the view.

Not Good!

From this list the 01004, 01503, 01506 and especially 01517 just jump right out and scream at you! Here in Europe, we have a right to have our names or addresses correctly written and, in Germany with all the umlauts, it can get difficult if you then have a 01517 but SQLCODE 0 result!

I hope you don’t find this newsletter too unsettling as, after all, Db2 and SQL normally works fine, but I do think that these SQLSTATEs should really have warranted a positive SQLCODE when they were first created…

What do you all think?

TTFN,

Roy Boxwell

Update:

One of my readers wonders how practicle these „errors“ are. A good point, and so here is a nice and easy recreate for the 01003 problem:

CREATE TABLE ROY1 (KEY1   CHAR(8) NOT NULL,                 
                   VALUE1 INTEGER ,                         
                   VALUE2 INTEGER )                         
;                                                           
INSERT INTO ROY1 (KEY1)               VALUES ('A') ;        
INSERT INTO ROY1 (KEY1)               VALUES ('AA') ;       
INSERT INTO ROY1 (KEY1,VALUE1)        VALUES ('B', 1) ;     
INSERT INTO ROY1 (KEY1,VALUE1,VALUE2) VALUES ('BB', 1 , 1) ;
INSERT INTO ROY1 (KEY1,VALUE1)        VALUES ('C', 2) ;     
INSERT INTO ROY1 (KEY1,VALUE1,VALUE2) VALUES ('C', 2 , 2) ; 
SELECT * FROM ROY1                                          
;                                                           
CREATE VIEW ROYVIEW1 AS                                     
(SELECT AVG(VALUE1) AS AVGVAL1, AVG(VALUE2) AS AVGVAL2      
 FROM ROY1)                                                 
;                                                           
SELECT * FROM ROYVIEW1                                      
;                                                           

This set of SQL ends up with these outputs:

---------+---------+---------+--------
KEY1           VALUE1       VALUE2    
---------+---------+---------+--------
A         -----------  -----------    
AA        -----------  -----------    
B                   1  -----------    
BB                  1            1    
C                   2  -----------    
KEY1           VALUE1       VALUE2    
---------+---------+---------+--------
C                   2            2    
DSNE610I NUMBER OF ROWS DISPLAYED IS 6

---------+---------+---------+---------+---------+---------+-----
    AVGVAL1      AVGVAL2                                                
---------+---------+---------+---------+---------+---------+-----
          1            1                                                
DSNT400I SQLCODE = 000,  SUCCESSFUL EXECUTION                           
DSNT418I SQLSTATE   = 01003 SQLSTATE RETURN CODE                        
DSNT415I SQLERRP    = DSN SQL PROCEDURE DETECTING ERROR                 
DSNT416I SQLERRD    = 0 0  0  -1  0  0 SQL DIAGNOSTIC INFORMATION       
DSNT416I SQLERRD    = X'00000000'  X'00000000'  X'00000000'  X'FFFFFFFF'
         X'00000000'  X'00000000' SQL DIAGNOSTIC INFORMATION
DSNT417I SQLWARN0-5 = W,,W,,, SQL WARNINGS                              
DSNT417I SQLWARN6-A = ,,,,   SQL WARNINGS                               
DSNE610I NUMBER OF ROWS DISPLAYED IS 1                                  

This is not so good if you ask me…

2023-12 Bufferpool Check

Hi all! Welcome to the end-of-year goody that we traditionally hand out to guarantee you have something to celebrate at the end-of-year party!

BPOOL

All Db2 releases since the very beginning of time have used Buffer Pools and when Data Sharing came along in DB2 V4 Group Bufferpools got invented. Since then bufferpools have always been with us and sadly no-one seems to really care about them anymore!

Checked?

When was the last time that you actually checked your local and group bufferpools? Have you really seen any problems? The fantastic thing about Db2 is that you can have 1000’s of problems occurring every second or two but it *still* just keeps on truckin‘ !

Where to Begin?

I always like to begin at the beginning and so review where you are right now by downloading and running the SOFTWARE ENGINEERING BufferPool Health check program! It is an extremely light weight tool that you must simply run *locally* on each and every member and it simply lists out what it finds as being bad, horrible or evil!

Old Advice

Refer to my „old“ blog to see what you could/should be checking and how bad it can really get as well.

Whaddya get?

The BufferPool HealthCheck is a one step program that simply lists out whatever it finds as being not good. At the end of the documentation is a table listing out all the checks it does. There is one important check it does *not* do and that is the cross-check between all local bufferpool sizes and the initial size of the related group bufferpool. That is just a little bit too complex for some freeware!

Want more?

If the results help you or you are interested in more, then our SQL WorkLoadExpert for Db2 z/OS product has a new separate licensable Use Case – Buffer Pool which contains all the checks plus the GBP Initial size one.

How does it look?

In this screen shot you see the list of Bufferpools being looked at and do you notice the highlights on a couple of tabs? Those yellow stripes should tell you that Bufferpool simulation is on in these two buffferpools. Simulation is really really good, it came in with Db2 11 but most people missed the launch event! Check it out as it is really good but beware! Do not simulate three or more Bufferpools at the same time!

Order By?

The order that you see is the importance list. In my humble opinion this is the list of KPIs that should be worked on from top to bottom and there are more than on this screen grab!

Fixes?

On the right-hand side, we then show you which corrective action is required, if any, to get the bufferpool running better, faster and cheaper!

On the overview highlights we list out what is Good, Bad and Ugly with direct links down to the details. Here will also come a ranking and a highlighting of the Tab to drag your eyes to the problem children that you undoubtedly have!

Here finally is then the first „top down“ view of all your local bufferpools so that you can quickly see the sizes and usage of your bufferpools

Naturally it all looks better in RL!

I would dearly love to hear from any of you who run this software and get before and after reviews! I am 100% sure that buffer pools and especially group buffer pools are simply being ignored these days!

TTFN

Roy Boxwell