

Hi! Continuing on with my AI blog (last one. I promise!) I wish to delve into the innards of the USS part of the SQL Data Insights experience and show you what it all costs!
A Quick Review Perhaps?
Please check my older newsletters for everything about install etc. of SQL DI, and one important thing which is the latest Vector Prefetch APARs (also see my last newsletter for details). Now. I will be doing “before and after” performance reviews with this feature on and off.
Bad News First!
What I have found, is that when I take a 500,000 row table into SQL DI and choose 17 columns, it takes the *entire* machine as well as all local page datasets and I was forced to cancel it after five hours…
Looking in the Logs…
If you go trawling around your Unix Directories, you will trip over these paths:
/u/work/sqldi
Home is Where the Spark is!
This is “home” where all of the SQL DI stuff is “installed”, naturally your name might be different!
Under here is the next layer of interest to me for the Spark processing.
It is Magic!
/u/work/sqldi/spark – Now this is where Spark does “the magic” and actually computes all your vector table data. It runs in stages and the first is the Base10 (I guess numeric analysis) part. For my test data it looks like this:
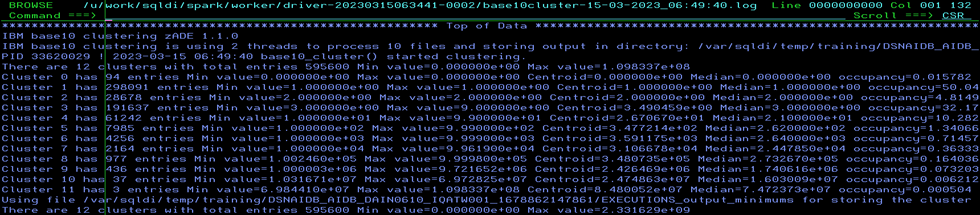
Scroll down to the bottom:
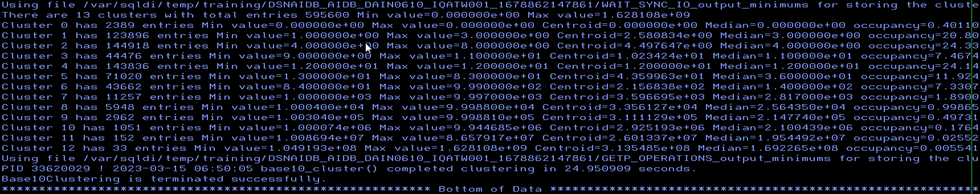
So, this ran really quickly!
Internals…
Then it does a ton of internal stuff and it starts actually doing the learning, which is “progressed” in a file like this:
/u/work/sqldi/spark/worker/driver-20230315063441-0002/ibm_data2vec-15-03-2023_07:15:01.log
Just Sitting There, Typing REF and Pressing ENTER…
Of course your name will be different, but just sitting there in OMVS and using the REF command you will see this file grow in size every now and again. When it does, quickly Browse on in and you will see stuff like this:
ibm-data2Vec (1.1.0 for zOS) starting execution using file /var/sqldi/temp/training/DSNAIDB_AIDB_DAI
ibm-data2vec found the required library: libzaio.so. Proceeding with the training..
ibm-data2vec will use following mode: CBLAS
User has not provided training chunk size. Using 1 GB chunk size for reading training file.
ibm-data2Vec is preallocating space for the model using user-provided value 1230314
ibm-data2Vec starting execution using file /var/sqldi/temp/training/DSNAIDB_AIDB_DAIN0610_IQATW001_1
83951683 ! 2023-03-15 07:17:27 ! Time elapsed learning vocab from train file = 145.91525s
Processed 13103200 words in the training file. There are 1213852 unique words in the vocabulary: Pri
Model training code will generate vectors for row-identifier (pk_id) or user-specified primary keys
83951683 ! 2023-03-15 07:17:27 ! Stage 1 completed. Time elapsed during file reading = 145.91643s
Training the database embedding (db2Vec) model using 12 CPU thread(s)
Whole Machine Gone – Oh Oh!
Now, in my case, it just sat there for a while taking all paging, all frames, all ziip and cp cpu and then it wrote out:
Epoch 0 learning rate Alpha=0.024704 Training Progress=5.00%
Epoch 0 learning rate Alpha=0.024404 Training Progress=10.00%
Epoch 0 learning rate Alpha=0.024099 Training Progress=15.00%
Epoch 0 learning rate Alpha=0.023791 Training Progress=20.00%
Epoch 0 learning rate Alpha=0.023486 Training Progress=25.00%
Epoch 0 learning rate Alpha=0.023182 Training Progress=30.00%
Epoch 0 learning rate Alpha=0.022885 Training Progress=35.00%
Epoch 0 learning rate Alpha=0.022582 Training Progress=40.00%
Epoch 0 learning rate Alpha=0.022286 Training Progress=45.00%
Epoch 0 learning rate Alpha=0.021980 Training Progress=50.00%
Epoch 0 learning rate Alpha=0.021673 Training Progress=55.00%
That last line was written out at 12:42 and after starting at 07:17 you can see that I still had nearly a five hour wait ahead of me. Time to cancel and rethink this!
Restart!
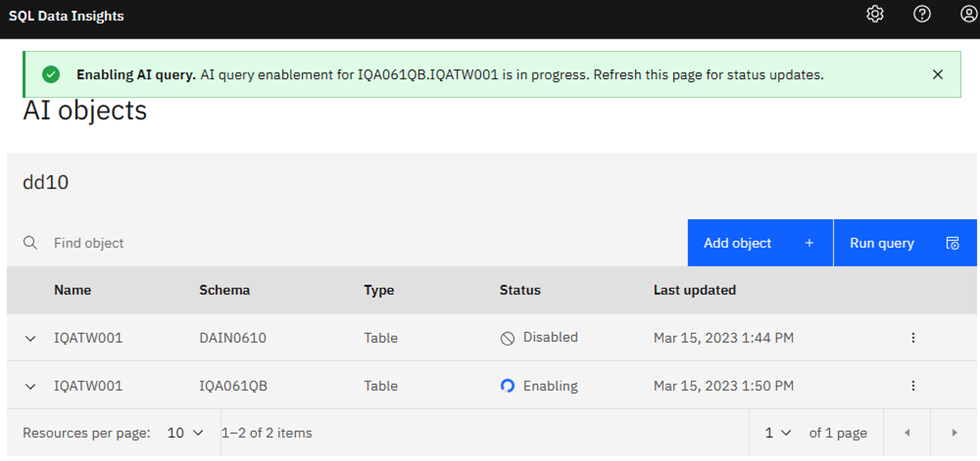
Thankfully, on the GUI interface (where you cannot see this progress info, sadly!) the “Stop training” button worked after a while. If it does not respond then you can just issue the
S SQLDAPPS,OPTION='SQLDSTOP'
command to stop it. Then, once all stopped, and the cpus have cooled down a bit, you can select a smaller data set and retry learning!
Smaller is Sometimes Better!
And with 40.000 rows it is much faster:
50397300 ! 2023-03-15 12:17:16 ! Stage 1 completed. Time elapsed during file reading = 26.992490s
Training the database embedding (db2Vec) model using 12 CPU thread(s)
Epoch 0 learning rate Alpha=0.024765 Training Progress=5.00%
Epoch 0 learning rate Alpha=0.024539 Training Progress=10.00%
Epoch 0 learning rate Alpha=0.024308 Training Progress=15.00%
Epoch 0 learning rate Alpha=0.024073 Training Progress=20.00%
Epoch 0 learning rate Alpha=0.023826 Training Progress=25.00%
Epoch 0 learning rate Alpha=0.023591 Training Progress=30.00%
Epoch 0 learning rate Alpha=0.023354 Training Progress=35.00%
Epoch 0 learning rate Alpha=0.023115 Training Progress=40.00%
Epoch 0 learning rate Alpha=0.022878 Training Progress=45.00%
Epoch 0 learning rate Alpha=0.022637 Training Progress=50.00%
Epoch 0 learning rate Alpha=0.022406 Training Progress=55.00%
Naturally, this is heavily dependent on the machine you have, the memory you have and the size of your local paging dataset.
EXPLAIN Yourself!
So now to do some EXPLAIN runs and then a quick comparison of the “double” AI Whammy that I have, quickly followed by the “New” PTF that, hopefully, sorts it all out.
Double Trouble?
You might have noticed that in my test SQLs I have to use the BiF AI twice. Once for the SELECT and once for the WHERE. This is because the use of the AI_VALUE column is not supported in the WHERE predicate.
Naturally, you can re-write the query to look like this:
SELECT * FROM
(SELECT AI_SEMANTIC_CLUSTER( PROGRAM,
                           'DSNTIAUL',
                           'DSN§EP2L',
                           'DSN§EP4L') AS AI_VALUE
      ,A.WLX_TIMESTAMP
      ,A.STMT_ID
      ,A.STMT_TIMESTAMP
      ,SUBSTR(A.PRIM_AUTHOR , 1 , 8) AS PRIM_AUTHOR
      ,SUBSTR(A.PROGRAM , 1 , 8) AS PROGRAM
      ,SUBSTR(A.REF_TABLE , 1 , 18) AS REF_TABLE
      ,A.EXECUTIONS
      ,A.GETP_OPERATIONS
      ,A.ELAPSE_TIME
      ,A.CPU_TIME
      ,A.STMT_TEXT
FROM DAIN0610.IQATW001 A
WHERE 1 = 1
  AND A.PROGRAM NOT IN    ('DSNTIAUL',
                           'DSN§EP2L',
                           'DSN§EP4L')
  AND A.STMT_ORIGIN = 'D'
  )
WHERE AI_VALUE IS NOT NULL
ORDER BY 1 DESC -- SHOW BEST FIRST
--ORDER BY 1 -- SHOW WORST FIRST
FETCH FIRST 10 ROWS ONLY ;
Does My Work File Look Big to You?
The problem is that now you have a HUGE work file… In my tests it was always much quicker to code the AI BiF twice. After all, it is always “Your Mileage May Vary”, “The Cheque is in the post” or “It depends”, isn’t it?
AI Does Use the Optimizer!
EXPLAIN Output… The AI Does indeed get output by EXPLAIN (I was surprised about this to be honest!) for the following query:
SELECT AI_SEMANTIC_CLUSTER( PROGRAM,
'DSNTIAUL',
'DSN§EP2L',
'DSN§EP4L') AS AI_VALUE
,A.WLX_TIMESTAMP
,A.STMT_ID
,A.STMT_TIMESTAMP
,SUBSTR(A.PRIM_AUTHOR , 1 , 8) AS PRIM_AUTHOR
,SUBSTR(A.PROGRAM , 1 , 8) AS PROGRAM
,SUBSTR(A.REF_TABLE , 1 , 18) AS REF_TABLE
,A.EXECUTIONS
,A.GETP_OPERATIONS
,A.ELAPSE_TIME
,A.CPU_TIME
,A.STMT_TEXT
FROM DAIN0610.IQATW001 A
WHERE 1 = 1
AND A.PROGRAM NOT IN ('DSNTIAUL',
'DSN§EP2L',
'DSN§EP4L')
AND AI_SEMANTIC_CLUSTER( PROGRAM,
'DSNTIAUL',
'DSN§EP2L',
'DSN§EP4L')
IS NOT NULL
AND A.STMT_ORIGIN = 'D'
ORDER BY 1 DESC -- SHOW BEST FIRST
--ORDER BY 1 -- SHOW WORST FIRST
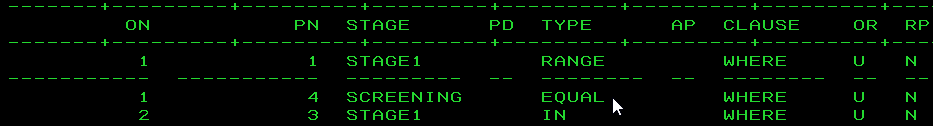
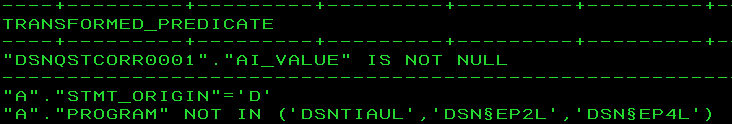
FETCH FIRST 10 ROWS ONLY ; The EXPLAIN output looks like:
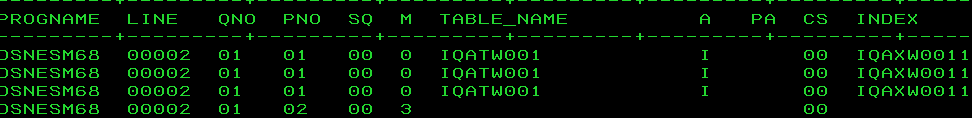
Then it gets an interesting STAGE2 RANGE predicate!
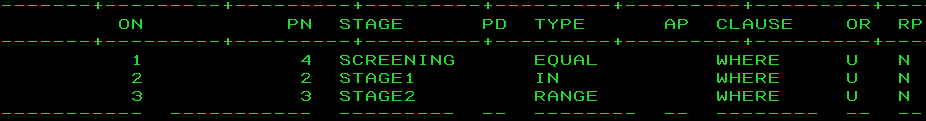
which resolves into:
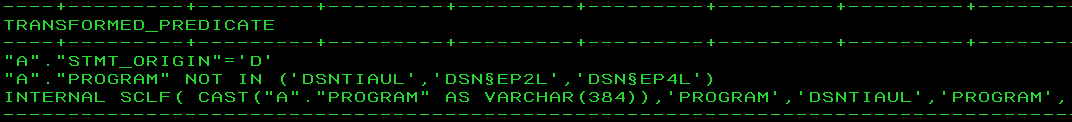
So here we see what the BiF is doing from the perspective of the Optimizer! If you run the nested table version of the query then this line does *not* appear at all!
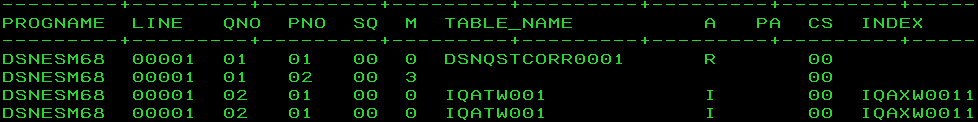
Notice here that the RANGE is now a STAGE1!
Optimize This!
So IBM Db2 has incorporated it into the Optimizer which is a good thing. But please remember: your SQL can have local predicates that cut down the size of the work file and so evens out the access times… Basically, you must code both and test to see which of the solutions is better for typical usage (As always really…)
Time, Measure, Repeat
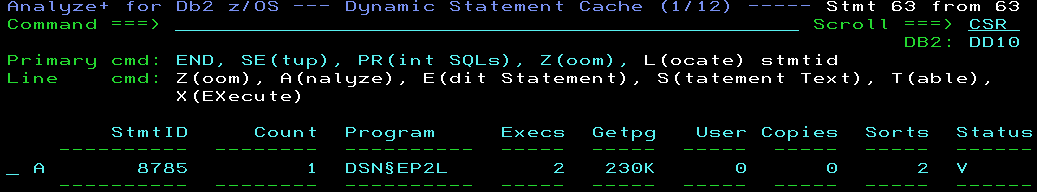
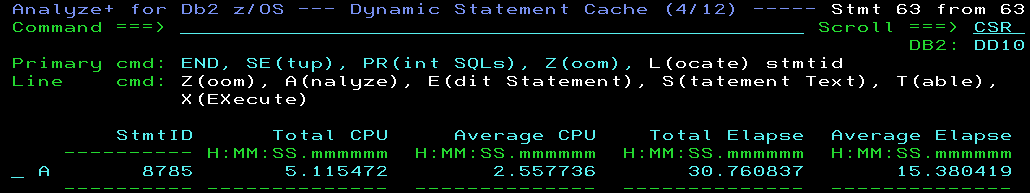
Ok, now just doing one execute of the double query requires 2.58 seconds of CPU and 15.35 seconds elapsed. The statement is *in* the DSC so prepare time can be ignored. Here you can see it has been executed twice so we have average values but I am using the CPU from the batch job as it is more precise.
Changing the query to now fetch back all rows instead of first ten requires 7.06 seconds of CPU and 48.78 seconds elapsed. But it returned over 200K rows!
While the query was running you can see the SQLD SQL DI in SDSF taking quite large chunks of zIIP time…

Now I will enable Vector Prefetch with a value of 10GB to see if it makes an impact for these queries. To do this you must update the ZPARM MXAIDTCACH and then enable the changed ZPARM.
That is Not What I was Expecting!
First query is now 2.56 CPU and 15.26 Elapsed. More like background noise than an improvement. And now with the FETCH FIRST removed 7.07 and 49.36 seconds. I guess my queries are not improved with Vector Prefetch!
Could be Me…
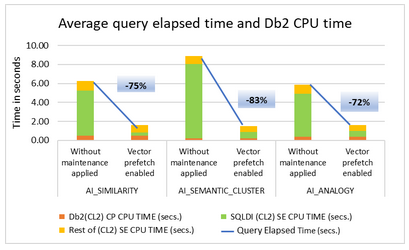
From the IBM Vector Prefetch docu:
With vector prefetch enabled, CPU performance for AI queries with AI function invocation on qualified rows improves particularly when the ratio of the cardinality of qualified rows to the total number of numeric vectors for the column is high.
https://community.ibm.com/community/user/datamanagement/blogs/neena-cherian/2023/03/07/accelerating-db2-ai-queries-with-the-new-vector-pr
Time to Join the Real World!
Now let’s try and see if I can discover something new in real data! Anything sensitive has been obfuscated!
SELECT AI_SIMILARITY( PROGRAM,
                     'IQADBACP') AS AI_VALUE
      ,SUBSTR(A.PRIM_AUTHOR , 1 , 8) AS PRIM_AUTHOR
      ,SUBSTR(A.PROGRAM , 1 , 8) AS PROGRAM
      ,SUBSTR(A.REF_TABLE , 1 , 18) AS REF_TABLE
      ,A.WLX_TIMESTAMP
      ,A.STMT_ID
      ,A.STMT_TIMESTAMP
      ,A.EXECUTIONS
      ,A.GETP_OPERATIONS
      ,A.ELAPSE_TIME
      ,A.CPU_TIME
      ,A.STMT_TEXT
FROM DAIN0610.IQATW001 A
WHERE 1 = 1
  AND NOT A.PROGRAM     = 'IQADBACP'
  AND     AI_SIMILARITY  ( PROGRAM,
                          'IQADBACP')
       IS NOT NULL
  AND     A.STMT_ORIGIN = 'D'
ORDER BY 1 DESC -- SHOW BEST FIRST
--ORDER BY 1 -- SHOW WORST FIRST
FETCH FIRST 10 ROWS ONLY;
This is similar to my test from last month but now on real data. Note that I have added a predicate A.STMT_ORIGIN = ‘D’ as I only want Dynamic SQL programs:
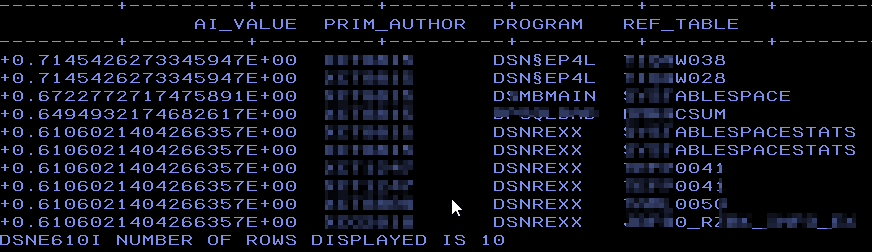
Dynamic Hits?
Here you can see that it has found a variety of programs that also do dynamic SQL but I also “helped” it by only asking for dynamic SQL. So now once again but this time without the predicate A.STMT_ORIGIN = ‘D’:
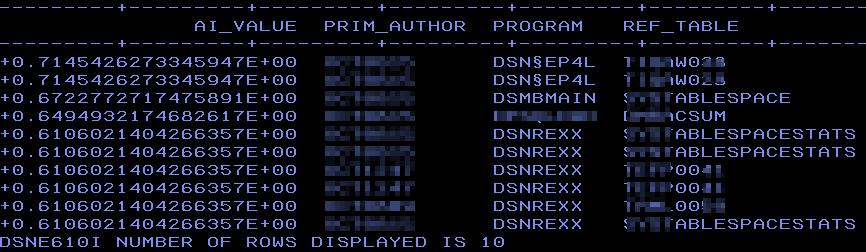
Success!
It has found nearly all from the first list but also different ones, crucially it has *not* found any Static SQL!
So, that’s enough of AI for the next few months for me. However, if you have any questions or ideas that I could try out feel free to email!
TTFN,
Roy Boxwell